![]()
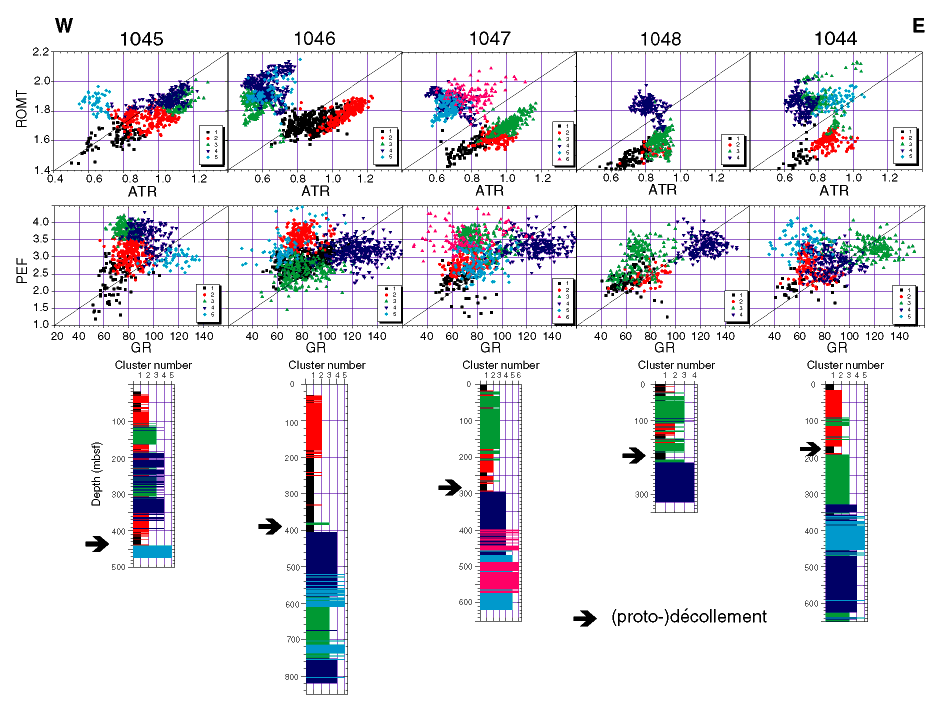
Figure F7. Comparative overview of results from multivariate statistical analysis at all sites from Leg 171A along the west-east transect. The cluster logs in the lower part of the figure are the same as in Figures F2, F3, F4, F5, and F6, and are shown for orientation reasons. The (proto-)décollement zone is indicated by an arrow. The colors in the crossplots in the upper part of the figure correspond to the colors in the cluster logs. By using the colors, the depths trends of the statistical electrofacies can be followed in the crossplots. The upper row of crossplots shows the density (ROMT)-resistivity (ATR) relation. At all sites, a linear ROMT-ATR relation can be seen for the depth section above the décollement. This linear relation is lost below the décollement, dramatically showing the change of physical properties above and below the décollement. The diagonal lines in the scatter plots are shown as reference lines and can be used for comparison purposes. The lower row of crossplots shows the photoelectric effect (PEF)-gamma ray (GR) relation. PEF and GR are mainly related to lithology. In all crossplots the dots are plotting in more or less the same region. Thus, the lithology does not change much with depth or distance from the deformation front. For further explanation see "Results and Discussion".
![]()