![]()
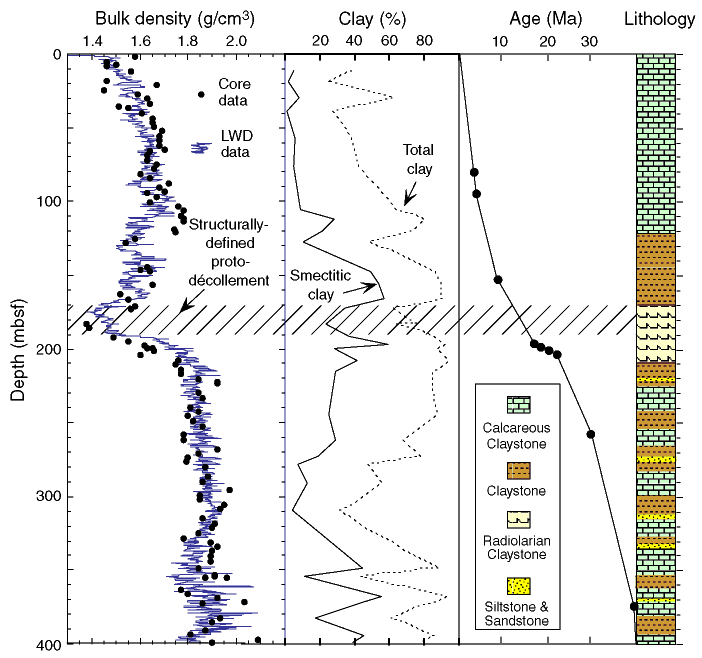
Figure F5. Comparison of core bulk density, clay mineralogy, sedimentation rates, structurally defined limits of the proto-décollement zone, and lithology from cores at Site 672 to LWD bulk density at colocated Site 1044 (Shipboard Scientific Party, 1988b; Tribble, 1990). Note the correlation of the low-density interval in the density curve with the proto-décollement zone and the radiolarian claystone.
![]()