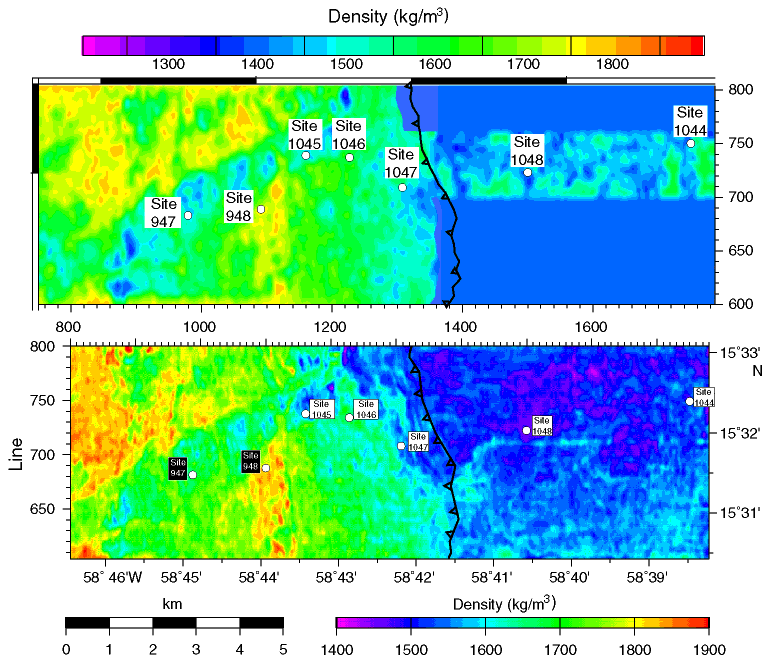
Figure F9. Density maps of the proto-décollement zone and décollement zone produced by inversion of seismic reflection data. Upper panel from Bangs et al. (1999) and lower panel from Zhao et al. (2000). Note that both show an overall increase in density with underthrusting west of the deformation front and a northeasterly trending area of reduced density beneath the accretionary prism west of the deformation front. The lower panel provides complete coverage of the proto-décollement zone and shows an increase in density to the south in the proto-décollement zone. Distance scales are equivalent, but note that separate density scales apply to the upper and lower panels of the diagram. (See also Frontispiece 2.)

![]()