![]()
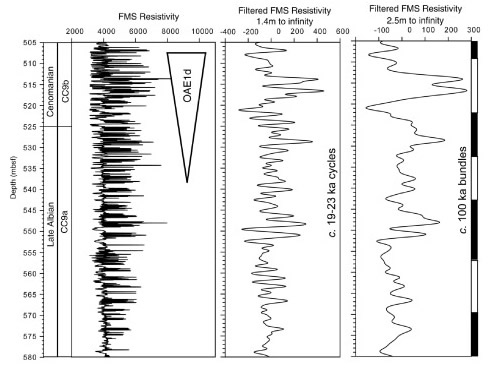
Fig. 5. High-resolution resistivity (FMS) log of ODP Hole 1052E (modified after Kroon et al. 1999). The interval shown is characterized by black shale formation paced by orbital cycles. The black shales are characterized by resistivity maxima. Lower frequencies of the Milankovitch spectrum can be observed in the upper part of the record. The record has been filtered (two panels to the right) to emphasize the low-frequency cycles. We interpret the 10 m cycle to be an expression of the eccentricity cycle (100 ka) and the 2 m cycle to be the precessional band (~21 ka).
![]()