Figure
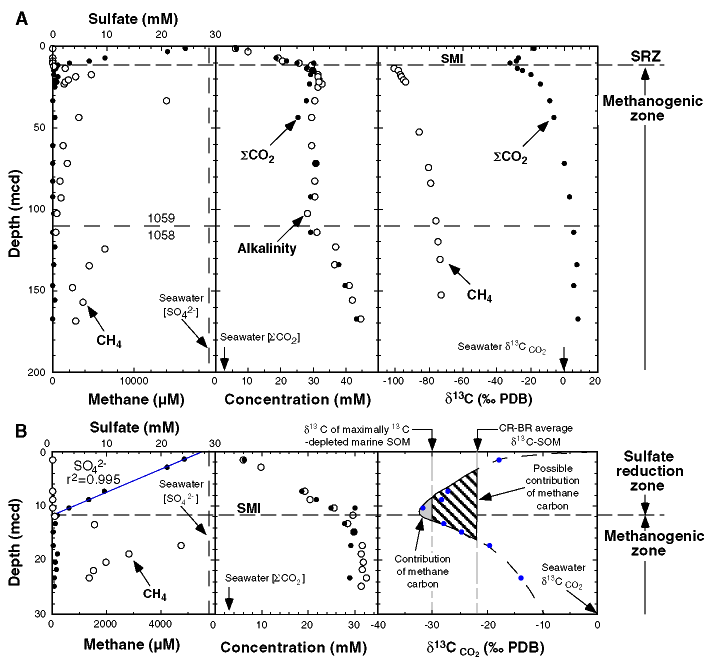
F2. Pore water concentration and carbon isotopic
composition profiles at Leg 172 Sites 1058 and 1059, plotted
as a single hole location (separated laterally by ~4 nmi).
Depth is plotted as meters corrected depth (mcd) below the
sediment-water interface (see Keigwin, Rio, Acton, et al.,
1998, for explanation). Data above 114.31 mcd (96.15 mbsf)
are from Site 1059; data below this depth are from Site
1058. A. The entire sampled sediment column
including the sulfate reduction zone (SRZ) and methanogenic
zone. B. The upper 30 m of the sediment
column showing profiles near the methane-sulfate interface (SMI).
Sulfate, methane, ![]() CO2,
and alkalinity values are reported in Table T1.
Methane concentration is reported as micromolar units (ÁM)(Keigwin,
Rio, Acton, et al., 1998); other concentration units are
millimolar (mM). Carbon isotopic values are reported in per
mil units (
CO2,
and alkalinity values are reported in Table T1.
Methane concentration is reported as micromolar units (ÁM)(Keigwin,
Rio, Acton, et al., 1998); other concentration units are
millimolar (mM). Carbon isotopic values are reported in per
mil units (![]() ,
relative to the Peedee belemnite [PDB] standard).
,
relative to the Peedee belemnite [PDB] standard). ![]() CO2
isotopic values are tabulated in Table T1;
methane isotopic values appear in Table T2.
In the shallow
CO2
isotopic values are tabulated in Table T1;
methane isotopic values appear in Table T2.
In the shallow ![]() 13C
13C![]() CO2
profile, the shaded portion of the profile illustrates
methane carbon in the CO2 pool likely derived
from methane through anaerobic methane oxidation, because
marine sedimentary organic matter (SOM) is typically more 13C-enriched
than -30
CO2
profile, the shaded portion of the profile illustrates
methane carbon in the CO2 pool likely derived
from methane through anaerobic methane oxidation, because
marine sedimentary organic matter (SOM) is typically more 13C-enriched
than -30![]() PDB (Deines, 1980). The hatched portion of the curve shows
carbon likely derived from methane because the isotopic
composition of average SOM in sediments of the Carolina Rise
and Blake Ridge is -21
PDB (Deines, 1980). The hatched portion of the curve shows
carbon likely derived from methane because the isotopic
composition of average SOM in sediments of the Carolina Rise
and Blake Ridge is -21![]() (e.g., Borowski, 1998). The lower boundary of the curve is
defined by a data point (-8.4
(e.g., Borowski, 1998). The lower boundary of the curve is
defined by a data point (-8.4![]() ,
33.45 mcd) that is not shown.
,
33.45 mcd) that is not shown.

![]()