![]()
Figure
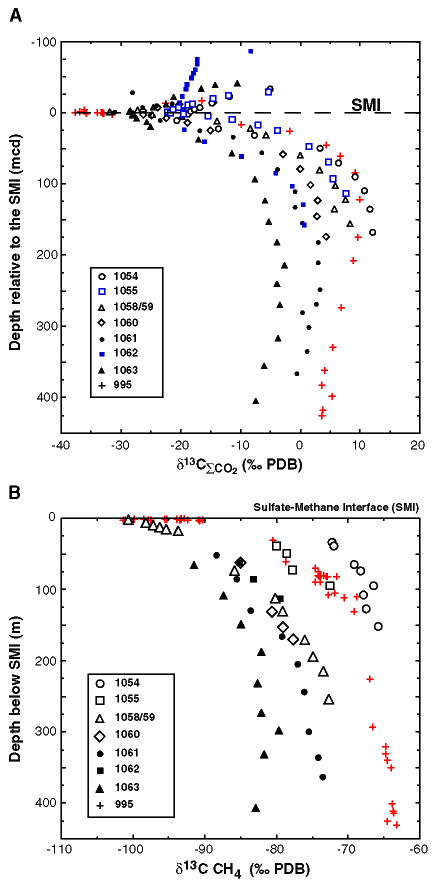
F3. (A) Carbon isotopic values of
interstitial dissolved CO2 and (B)
methane plotted as a function below the seabed in meters
(meters corrected depth, mcd; see Keigwin, Rio, Acton, et
al., 1998) relative to the sulfate-methane interface (SMI). ![]() CO2
isotopic values are tabulated in Table T1;
methane isotopic values appear in Table T2.
Site 995 data (ODP Leg 164) for
CO2
isotopic values are tabulated in Table T1;
methane isotopic values appear in Table T2.
Site 995 data (ODP Leg 164) for ![]() CO2
and methane are from Borowski et al. (2000) and Paull et al.
(2000), respectively.
CO2
and methane are from Borowski et al. (2000) and Paull et al.
(2000), respectively.
![]()