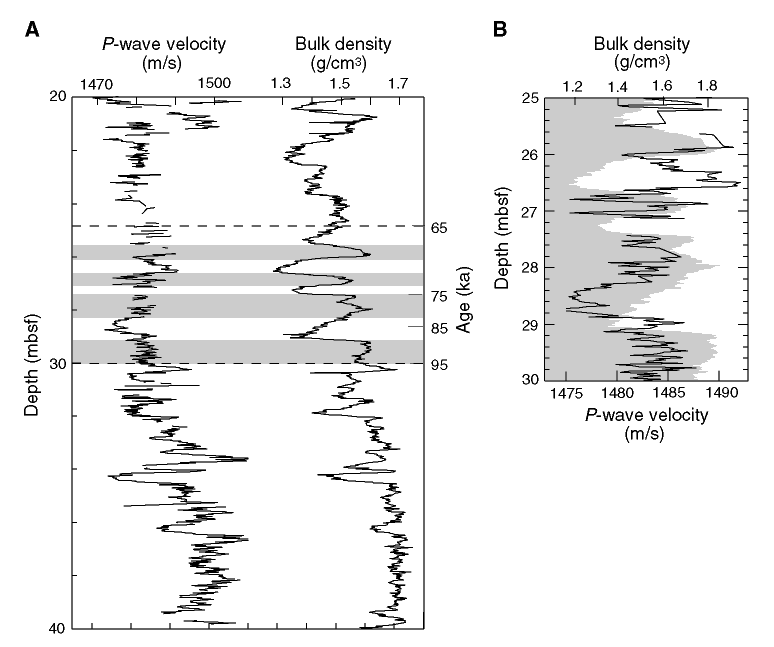
Figure F2. Physical properties records at Hole 1063D. A. A long portion of the hole with the study interval between the dashed lines. This interval, corresponding to the transition between glacial Stage 4 and interglacial Stage 5, was chosen because of obvious Dansgaard-Oeschger (D-O) cycles (interstadial periods are shaded areas). B. Expanded view of the study interval showing phase relationships between P-wave velocity (black line) and bulk density (shaded area).

![]()