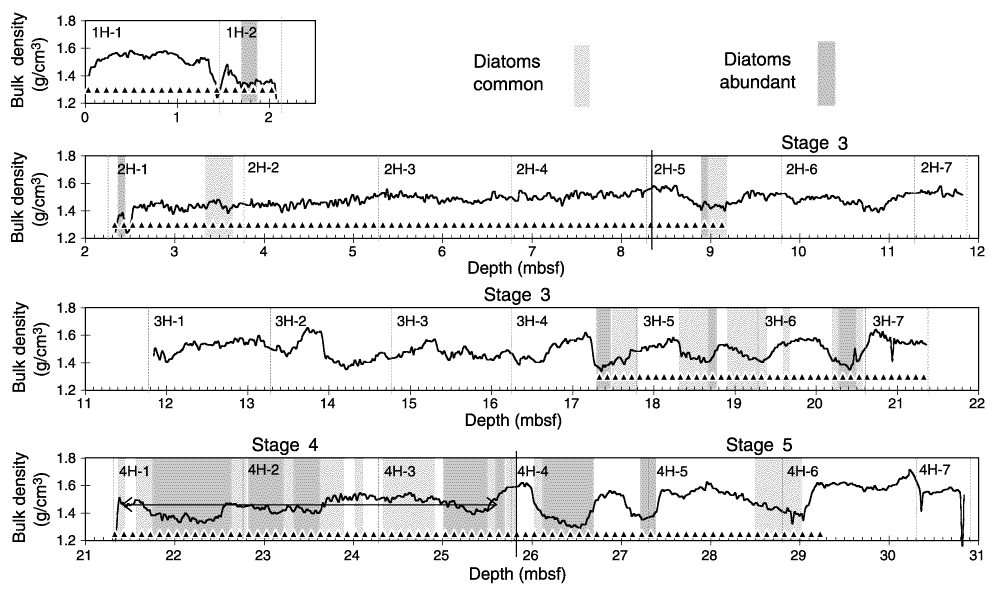
Figure F1. Chart with GRA bulk-density values for the upper four cores of Hole 1063D. Stages 3, 4, and 5 are indicated above their associated intervals of the record. Triangles = samples examined in this study (every 10 cm), dotted vertical lines = core breaks.

![]()