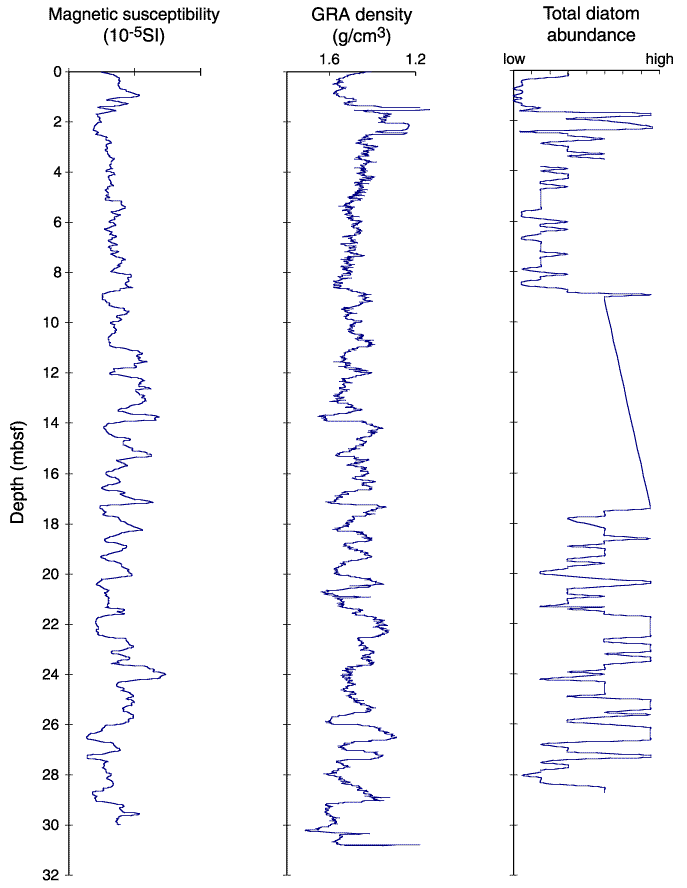
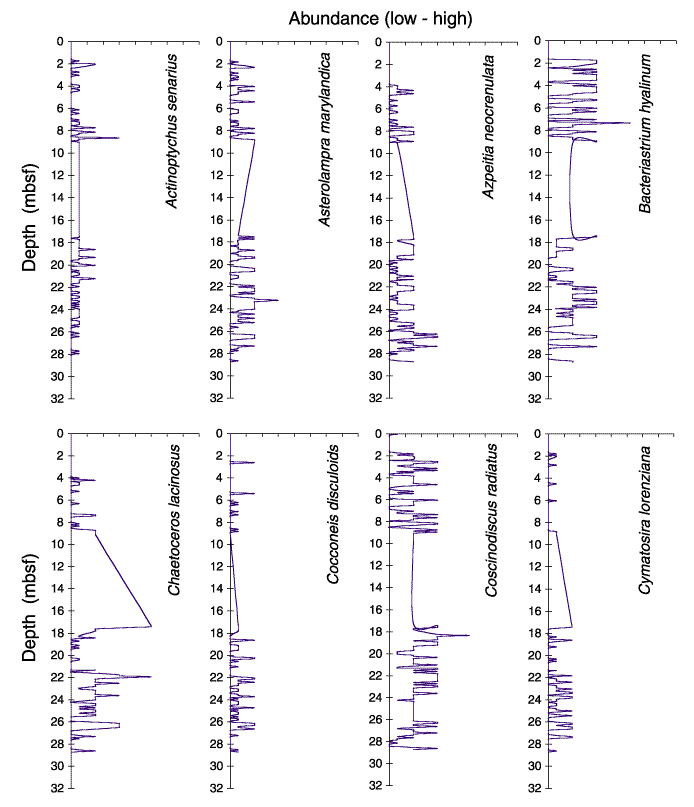
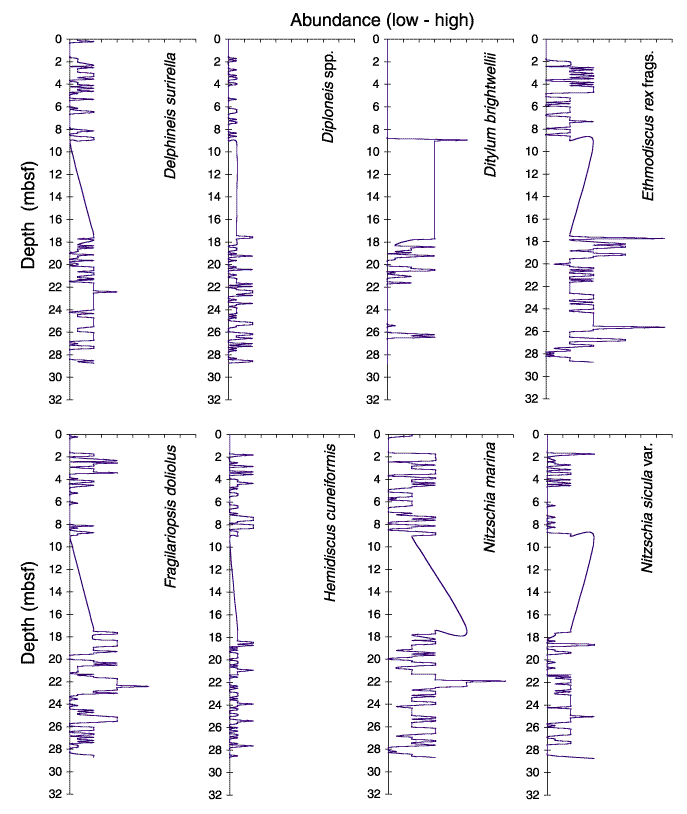
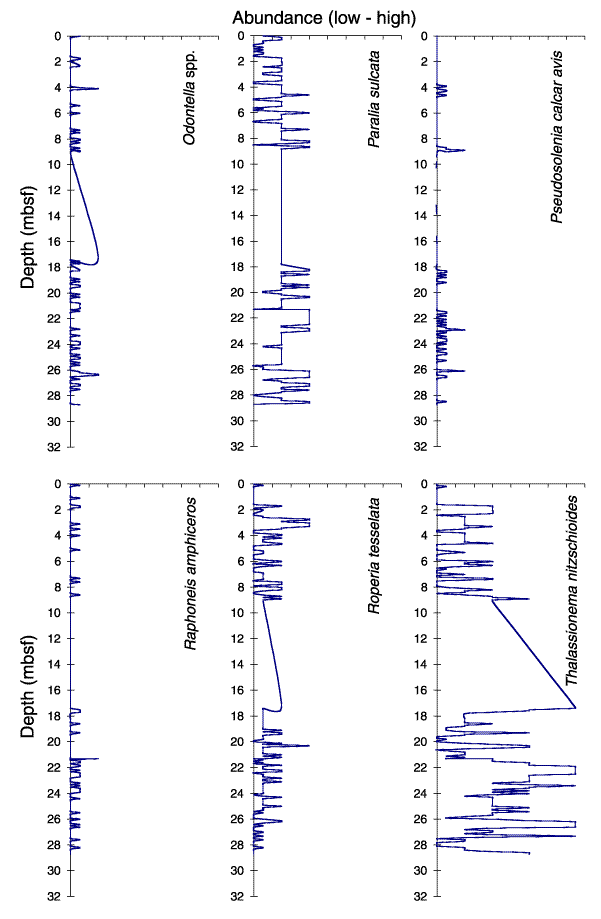
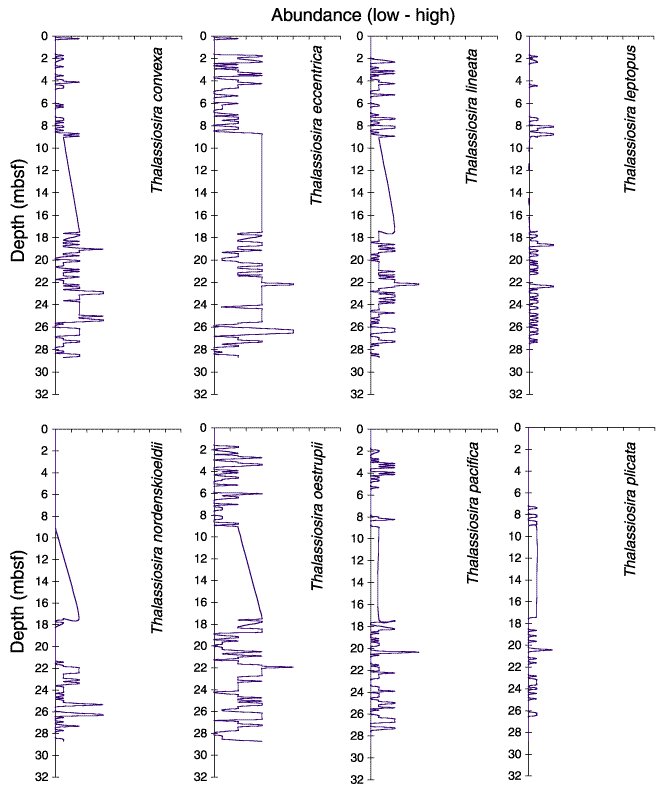
Figure F3. Comparison of depth vs. abundance for selected diatom species. Abundance increases to the right with quantitative assignments of 75 = A, 50 = C, 30 = F, 15 = R, and 5 = X. Magnetic susceptibility, GRA bulk density, and total diatom abundance are also illustrated.
![]()