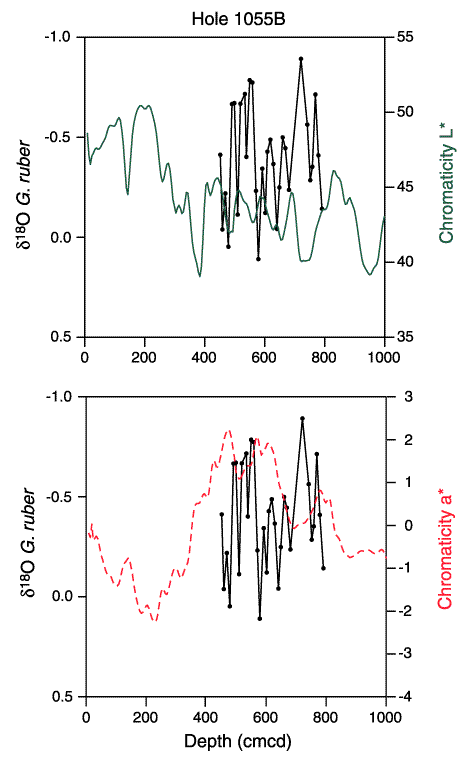
Figure F4.
Comparison of shipboard color reflectance data with  18O data (from Fig. F3) at Hole 1055B. Note that the LGM is marked by dark sediment at ~400 cm (lower chromaticity L*; solid line), but that the reddest sediment (higher chromaticity a*; dashed line) occurs in Stage 3. Two peaks, at ~500 and 600 cmcd, are matched by maximum
  18O. This strengthens the association between cooling climate and red sediment in Leg 172 sites. Solid circles =
  18O of G. ruber.

![]()