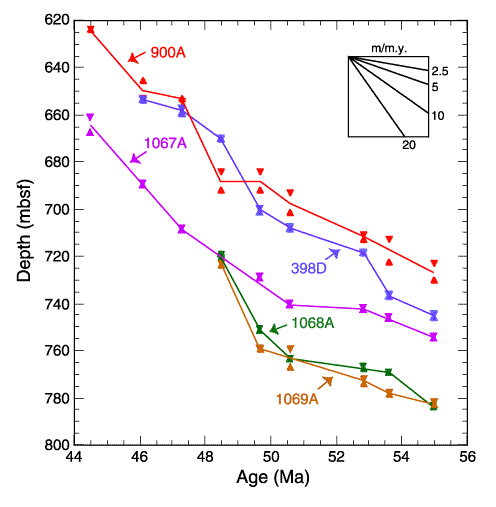
Figure F5. Age-depth plot for Holes 1067A, 1068A, 1069A, 900A, and 398D. Comparison slopes are given in the upper right corner. Pairs of opposed triangles indicate the thickness range of each nannofossil datum. See Tables T2, T4, T6, T7, and T8 for datums used.

![]()