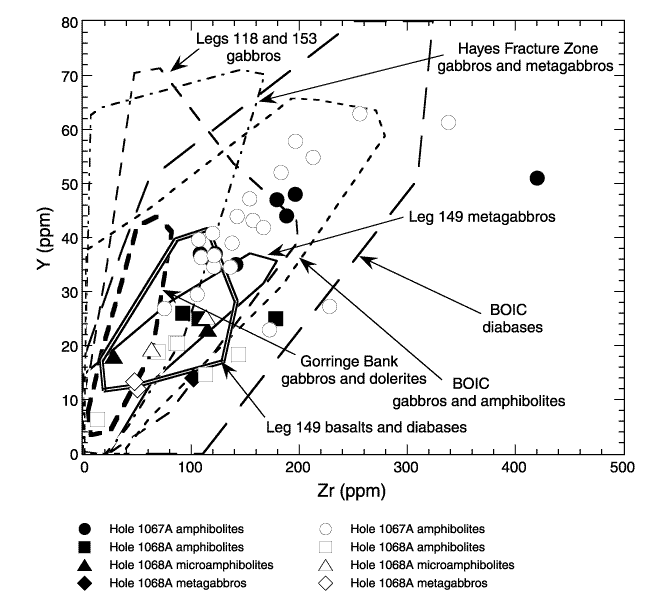
Figure F4. Zr vs. Y variation diagram. Site 1067 amphibolite, Site 1068 amphibolite, Site 1068 microamphibolite, and Site 1068 metagabbro compositions are shown for the Leg 173 shipboard analyses (solid symbols) and from this report (open symbols). Fields represent data for the Leg 149 metagabbros, Gorringe Bank gabbros and dolerites (west Iberia margin), Leg 118 gabbros (Southwest Indian Ridge), Leg 153 gabbros (Mid-Atlantic Ridge), Hayes Fracture Zone gabbros (Mid-Atlantic Ridge), and Bay of Islands (BOIC) ophiolitic gabbros, amphibolites, and diabases (Newfoundland, Canada). The Leg 173 samples are most similar to the Leg 149 samples and Bay of Islands ophiolitic samples. Data are from Cannat, Karson, Miller, et al. (1995); Casey (1997); Casey et al. (1985); Cornen et al. (1999); Cornen et al. (1996); McNeil (1985); Robinson, Von Herzen, et al. (1989); Seifert and Brunotte (1996); Seifert et al. (1996); Smith (1994); Smith (1985); Whitmarsh, Beslier, Wallace, et al. (1998); and J.F. Casey (unpubl. data).

![]()