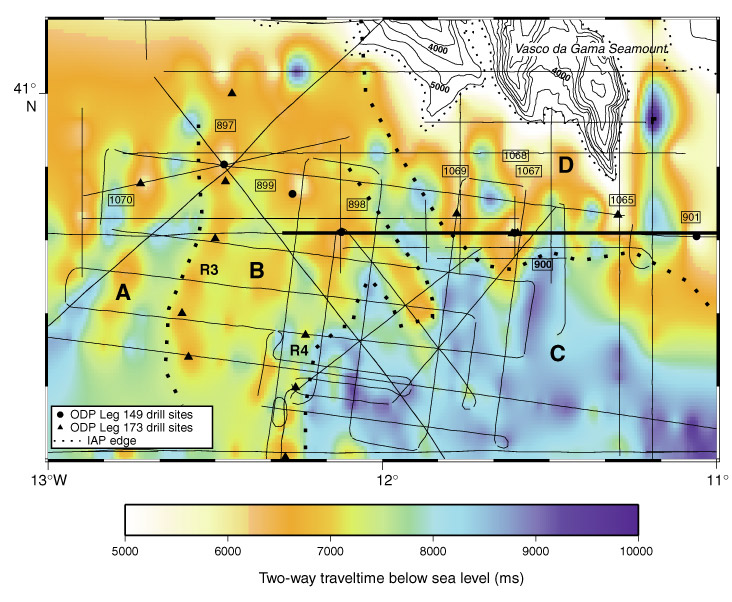
Figure F3. A contoured basement chart (0.25-s two-way traveltime contour interval) based on reflection profiles acquired up to 1997, from Whitmarsh et al. (in press) after Russell (1999). Tracks of multichannel seismic reflection profiles (thin lines) used to construct the chart and locations of ODP drill sites are also shown. Seafloor bathymetry (contoured in meters) is shown north of the edge (fine dotted line) of the Iberia Abyssal Plain. The thick line is the part of profile Lusigal-12 shown in Figure F5. Regions A, B, C, and D are discussed in the text.
![]()