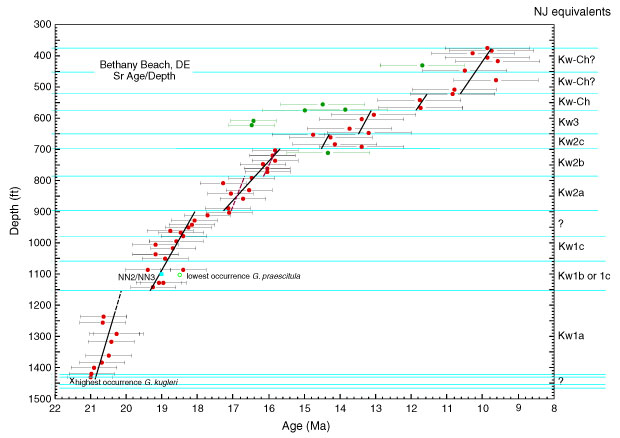
Figure F10. Age-depth plot for the Miocene sequences from the Bethany Beach borehole. Error bars = 2  for one analyses (Oslick et al., 1994). Points plotted in green are interpreted as diagenetically altered or stratigraphically reworked (see "Strontium Isotope Chronostratigraphy"). Dashed lines = uncertain or alternate age model, thin horizontal lines = sequence boundaries. Right column indicates probable correlations to New Jersey sequences using the Kw (Kirkwood) sequence nomenclature of Miller et al. (1997). Timescale after Berggren et al. (1995).