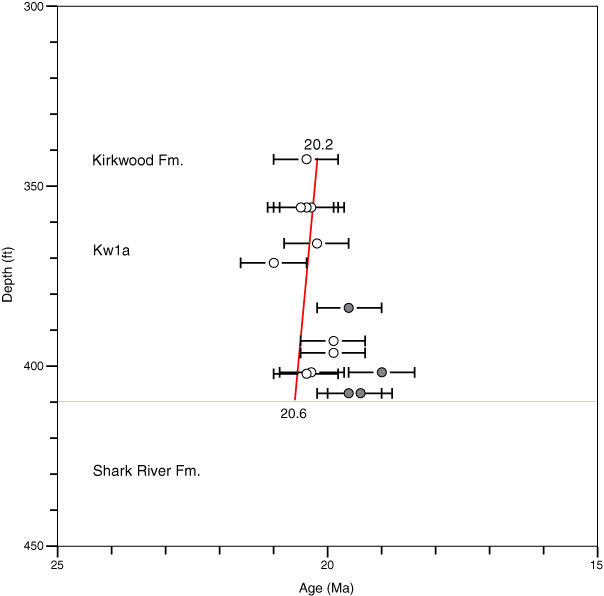
Figure F10. Age depth plot for the Miocene from the Millville borehole. Error bars are two standard deviations for one analysis (Oslick et al., 1994). Solid points are interpreted as diagenetically altered or stratigraphically reworked (see text). Thin horizontal lines indicate sequence boundaries. Timescale after Berggren et al. (1995). Fm. = formation.