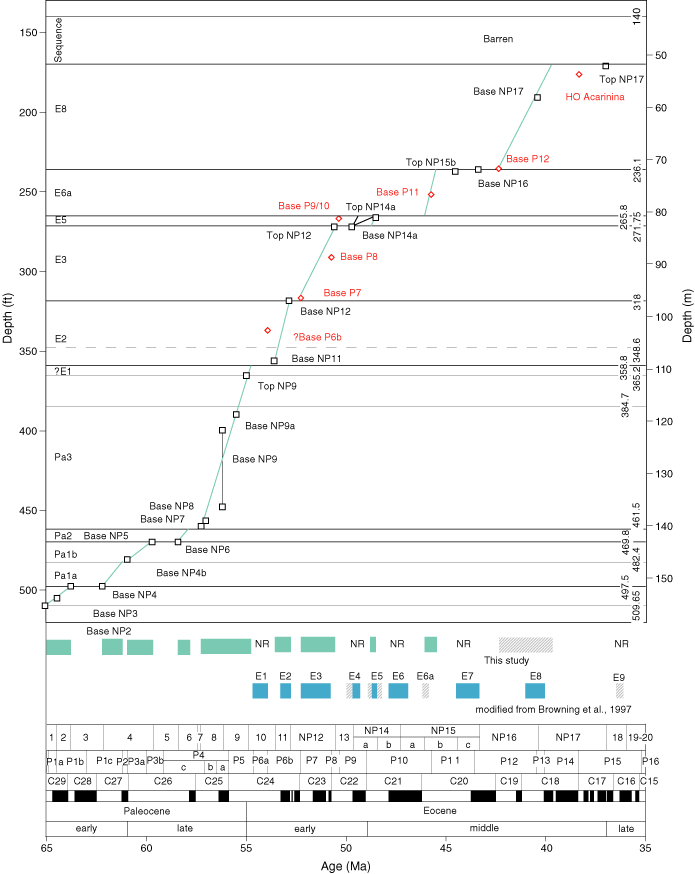
Figure F18. Cenozoic age-depth plot for the Sea Girt corehole. Black squares represent the tops and bottoms of calcareous nannoplankton zones. Red squares represent tops and bottoms of planktonic foraminiferal zones. Horizontal lines indicate sequence boundaries. Blue boxes along the bottom indicate time represented. Timescale after Berggren et al. (1995).


![]()