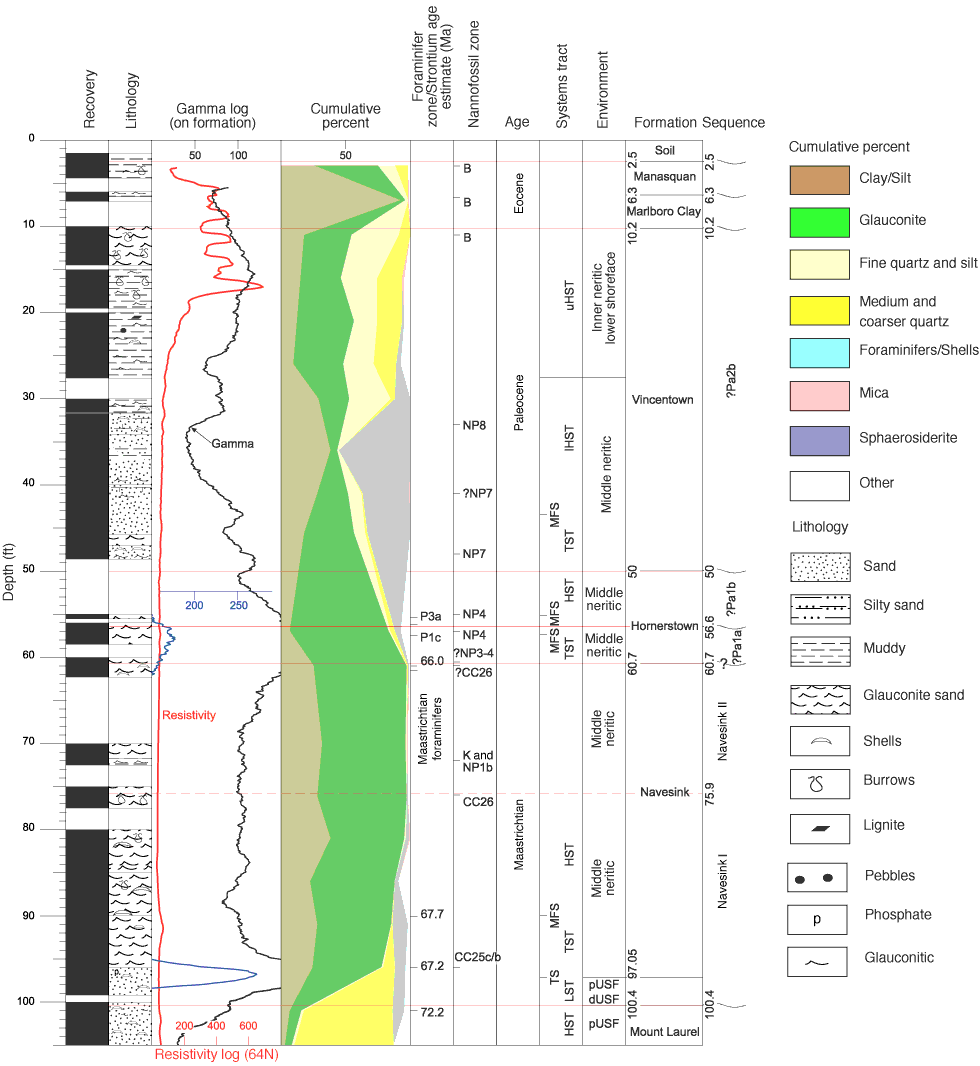
Figure F2. Summary stratigraphic section for the Manasquan Formation (lower Eocene), Marlboro Clay (lowermost Eocene), Vincentown (Paleocene), Hornerstown (Paleocene), and Navesink (Maastrichtian) formations in the Medford borehole. NP Zones are from Martini (1971) and Martini and Müller (1986). P Zones are from Berggren et al. (1995). Pa1a, Pa1b, and Pa2b are sequences defined by Harris et al. (submitted). Navesink I and Navesink II are sequences defined by Miller et al. (2003). B = barren. K = Cretaceous. Red lines = sequence boundaries. MFS = maximum flooding surface, TS = transgressive surface, uHST = upper highstand systems tract, lHST = lower highstand systems tract, TST = transgressive systems tract, HST = highstand systems tract, LST = lowstand systems tract. pUSF = proximal upper shoreface, dUSF = distal upper shoreface.


![]()