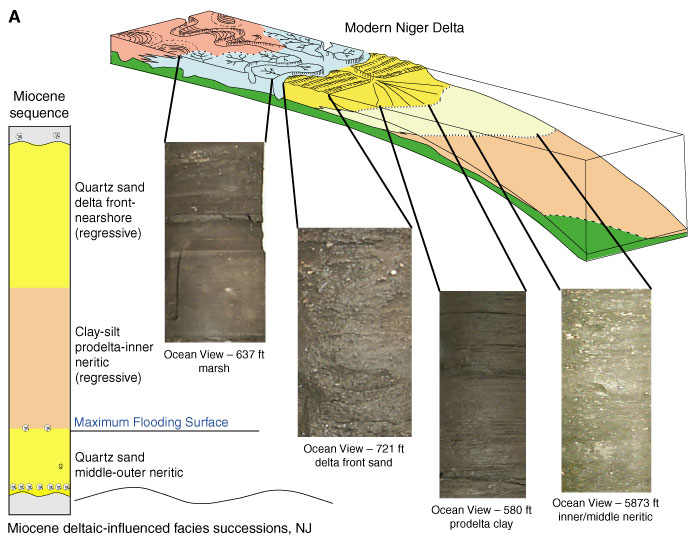
Figure F2. A. Facies model for deltaic-dominated facies showing core photographs from the Miocene section at Ocean View. Modern environments from the Niger Delta (Allen, 1970) are illustrated at the top. On left is a summary of facies successions within a Miocene onshore sequence (modified after Sugarman et al., 1993).
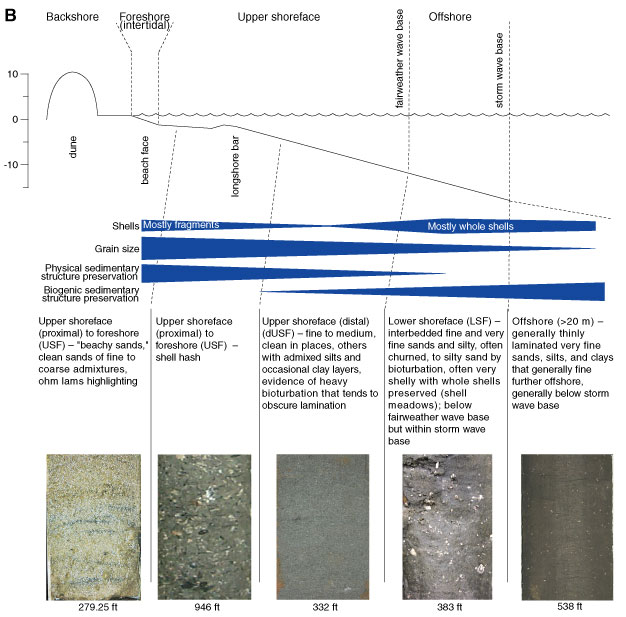
B. Facies model for wave-dominated nearshore sedimentation, Miocene of
Delaware. Trends in textural characteristics shown by bars of varying widths are
generalized; see text for explanation. Photographs are examples of each facies
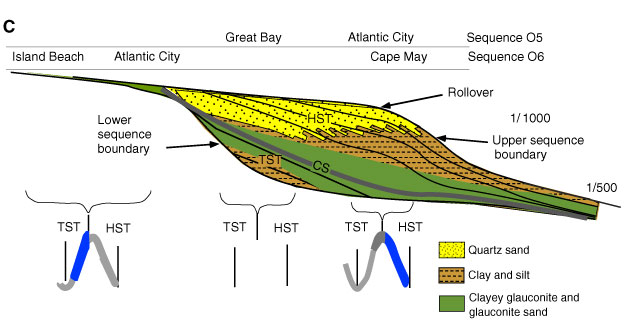
in core from given levels in the Bethany Beach borehole. C. Conceptual
architecture of an upper Oligocene sequence in New Jersey with borehole
locations appropriate for sequences O5 and O6. Stratigraphic intervals preserved
for each location are indicated in blue on the sea-level representations,
striped intervals = nondeposition or erosion, gray = uncertainty. TST =
transgressive systems tract, HST = highstand systems tract (after Pekar et al.,
in press b).


![]()