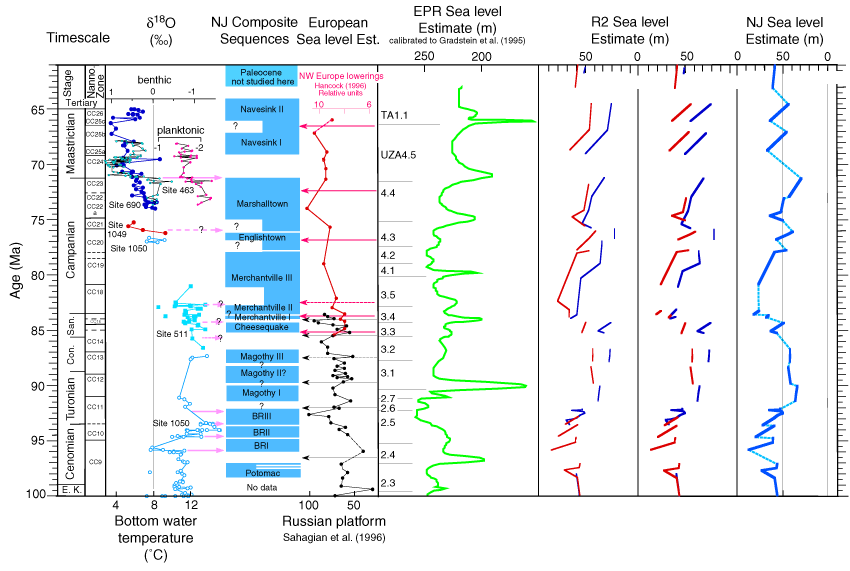
Figure F6. Comparison of Late Cretaceous deep-sea oxygen benthic foraminiferal  18O records (Site 463, Barrera and Savin, 1999; Site 690, Barrera and Savin, 1999; Site 511, Fassel and Bralower, 1999; Sites 1049 and 1050, Huber et al., 2002), planktonic foraminiferal
  18O records (Site 463, Barrera and Savin, 1999), New Jersey composite sequences (derived from Fig. F5), the relative sea-level curve from northwest Europe (red continuous line; Hancock, 1993) and the backstripped record from the Russian platform (black continuous line; Sahagian et al., 1996), the EPR eustatic estimate (green line, Haq et al., 1987), backstripped R2 eustatic estimates for Bass River (pink discontinuous lines) and Ancora (red discontinuous lines), and our best estimate of eustatic changes derived from the R2 curves (dark blue indicates portions of the curve constrained by data, light blue indicate portions inferred). Pink arrows indicate positive
  18O inflections (inferred cooling and/or ice volume increases). For the composite: blue boxes = time represented, white areas = hiatus, thin white lines = inferred hiatuses. Arrows are drawn through the inflection points of the European records. E.K. = Early Cretaceous (after Miller et al., unpubl. data).


 18O records (Site 463, Barrera and Savin, 1999; Site 690, Barrera and Savin, 1999; Site 511, Fassel and Bralower, 1999; Sites 1049 and 1050, Huber et al., 2002), planktonic foraminiferal
  18O records (Site 463, Barrera and Savin, 1999), New Jersey composite sequences (derived from Fig. F5), the relative sea-level curve from northwest Europe (red continuous line; Hancock, 1993) and the backstripped record from the Russian platform (black continuous line; Sahagian et al., 1996), the EPR eustatic estimate (green line, Haq et al., 1987), backstripped R2 eustatic estimates for Bass River (pink discontinuous lines) and Ancora (red discontinuous lines), and our best estimate of eustatic changes derived from the R2 curves (dark blue indicates portions of the curve constrained by data, light blue indicate portions inferred). Pink arrows indicate positive
  18O inflections (inferred cooling and/or ice volume increases). For the composite: blue boxes = time represented, white areas = hiatus, thin white lines = inferred hiatuses. Arrows are drawn through the inflection points of the European records. E.K. = Early Cretaceous (after Miller et al., unpubl. data).

![]()