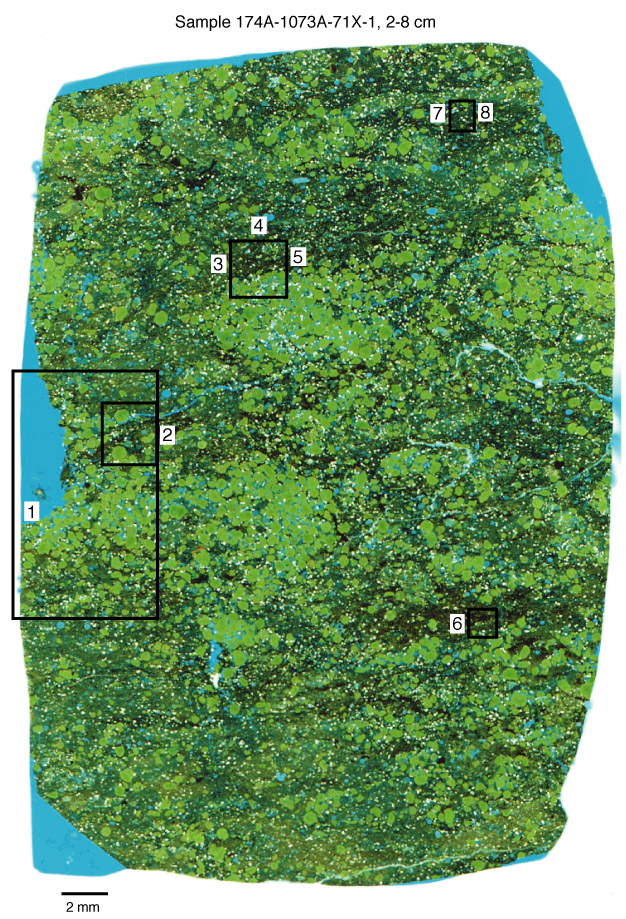
Figure AF16.
Thin section image from whole core. Black boxes identify regions analyzed by SEM. Numbers identify SEM image(s) for that region.