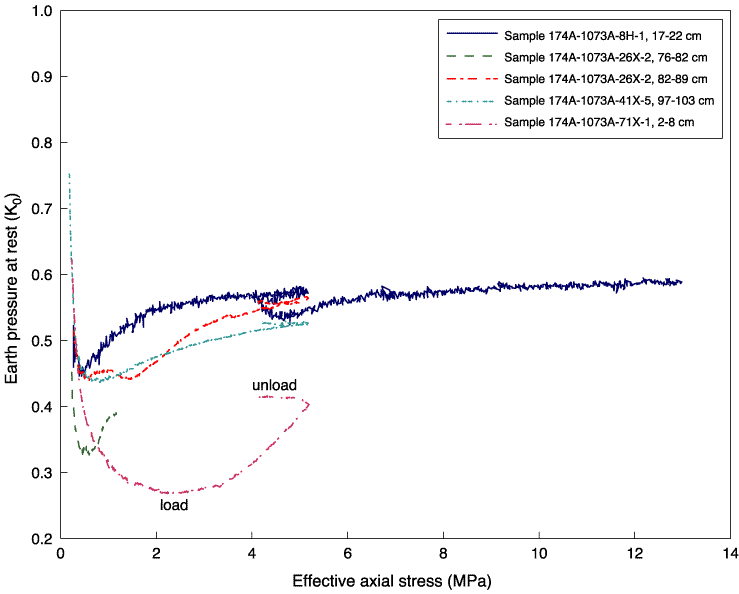
Figure F4. Earth pressure at rest (Ko) for samples during deformation experiments. An example of the load/unload path is labeled for Sample 174A-1073A-71X-1, 2-8 cm. All samples exhibit an initial decrease in Ko followed by an increase. Samples 174A-1073A-8H-1, 17-22 cm, 26X-2, 82-89 cm, and 41X-5, 97-103 cm, approach approximately the same Ko value. Lower Ko for Sample 174A-1073A-71X-1, 2-8 cm, reflects its difference in lithology from the other samples. Raw data are provided in Tables T3,
T4, T5,
T6, and T7.


![]()