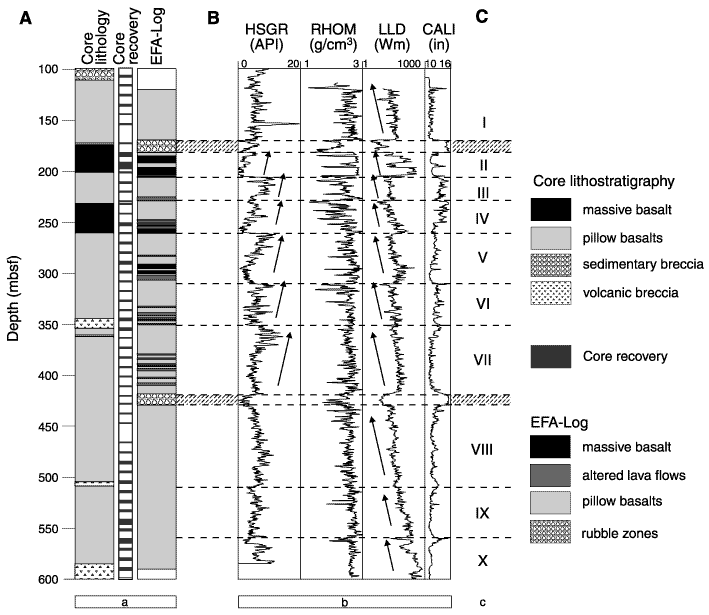
Figure F4. Summary of log interpretation in Hole 395A, after Bartetzko et al. (in press). A. Comparison between the core lithostratigraphy (Melson, Rabinowitz, et al., 1979) and the synthetic EFA log. The latter shows more details and yields a more precise definition of individual units than the lithostratigraphy based on cores with incomplete recovery. B. Many of the logs show clear cyclic trends, marked with arrows. HSGR = gamma ray log, RHOM = neutron density, LLD = deep laterolog resistivity, CAL1 = borehole diameter. C. The cyclic trends are interpreted to represent cycles of volcanic eruptions, labeled I through X.

![]()