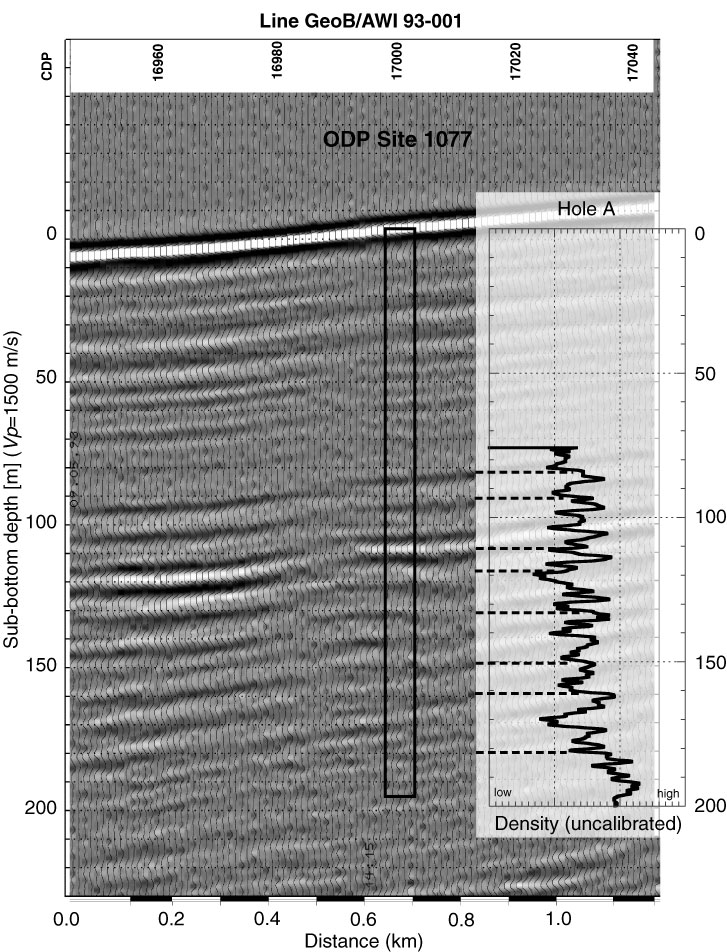
Figure 12. Close-up of Line GeoB/AWI 93-001 near Site 1077. Amplitudes are grayscaled. For comparison, the resistivity data from downhole logging are shown, which are inversely proportional to density. Main reflectors are correlated with local extremes in the density log. For depth determination, a sound velocity (Vp) of 1500 m/s was used.


![]()