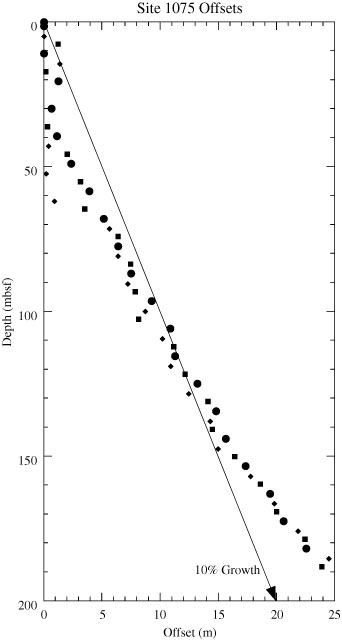
Figure 25. Core offsets applied to Site 1075 plotted against standard ODP meters below seafloor (mbsf). A linear 10% growth of meters composite depth (mcd) compared with mbsf is indicated by an arrow. Offsets are plotted for Holes 1075A (circles), 1075B (diamonds), and 1075C (squares).


![]()