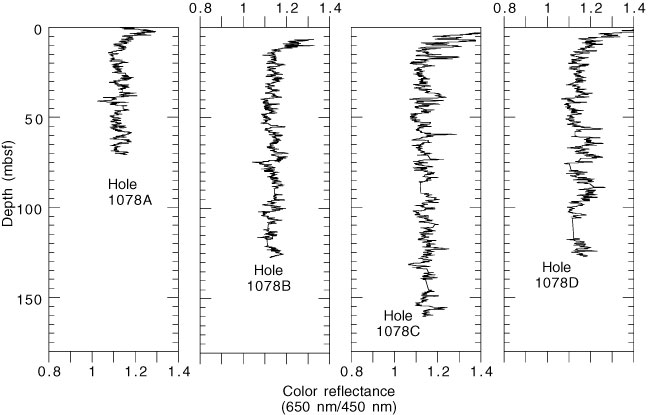
Figure 16.
Stratigraphic variation in the ratio of the red (650 nm) to blue (450 nm) wavelengths at Holes 1078A, 1078B, 1078C, and 1078D. A five-point smoothing average was applied to the data set.