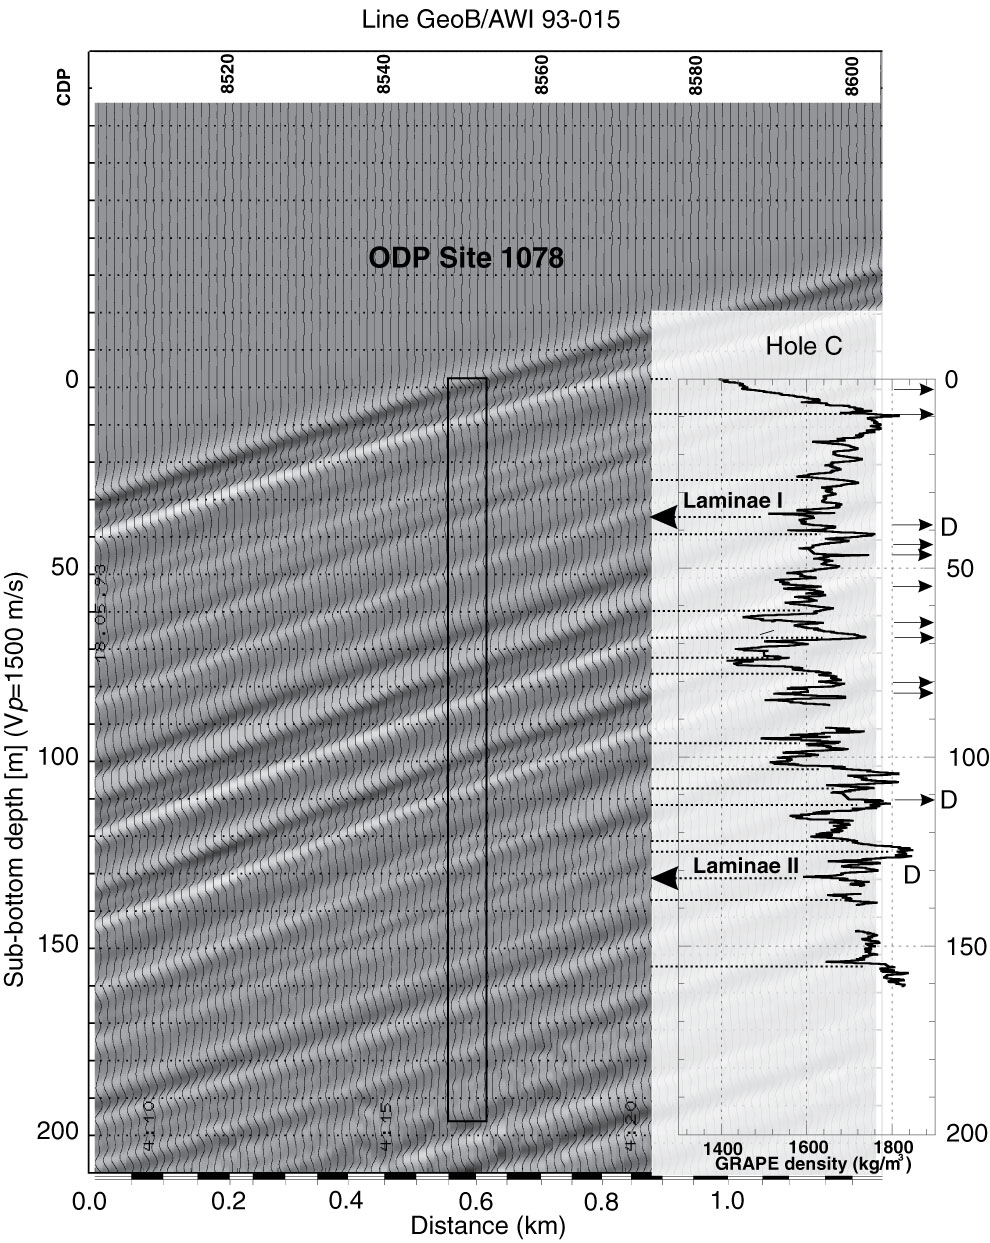
Figure 6. Close-up of Line GeoB/AWI 93-015 near Site 1078. Amplitudes are grayscaled. For comparison, wet bulk density data from index properties measurements are shown, and main reflectors are correlated with local extremes in the density log (thick dashed lines). For depth determination, a sound velocity (Vp) of 1500 m/s was used. Small arrows = extreme values in GRAPE density above 1800 kg/m3; large arrows = laminated intervals; and D = descriptions of dolomitized layers in cores.