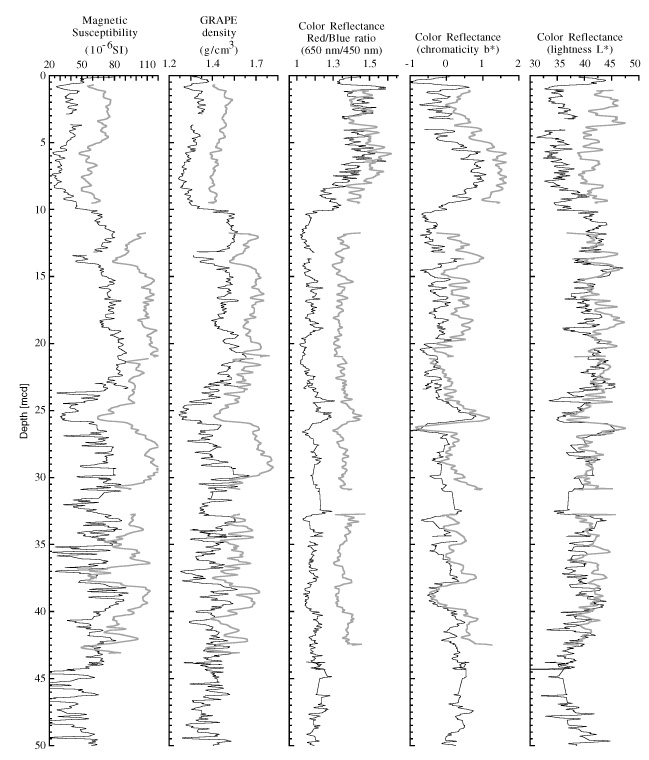
Figure 11. Composite section for Site 1080. Magnetic susceptibility, GRAPE bulk density, and the color reflectance (chromaticity b*, red/blue ratio [650 nm/450 nm], and lightness L*) data are plotted for Holes 1080A (black line) and 1080B (gray line). The downhole logs are shown in meters composite depth (mcd). An offset 1.5 times the standard deviation of the Hole 1080A data has been applied to Hole 1080B for clarity in viewing the composite sections.