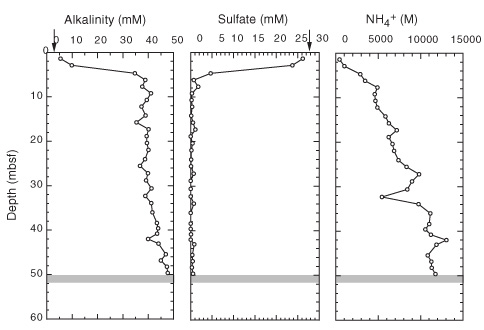
Figure 14. Downcore profiles of dissolved alkalinity, sulfate, and ammonium at Site 1080. Arrows = mean ocean-bottom-water values taken from Millero and Sohn (1992). Shaded region = position of dolomite layer; no particular layer thickness is implied.