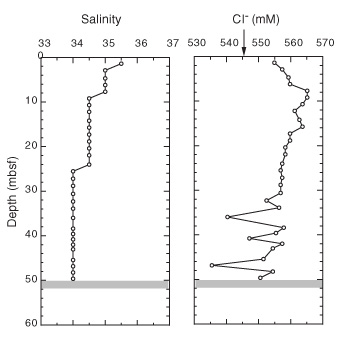
Figure 18.
Downcore profiles of salinity and dissolved Cl
–
at Site 1080. Arrow = mean ocean-bottom-water value taken from Millero and Sohn (1992). Shaded region = position of dolomite layer; no particular layer thickness is implied.