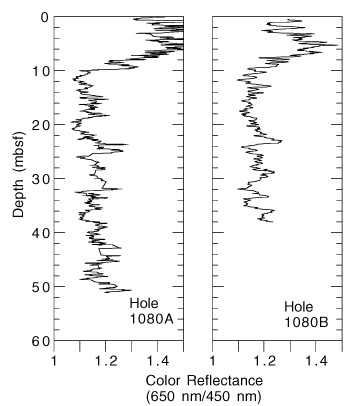
Figure 6.
Downcore variation in the ratio of the red (650 nm) to blue (450 nm) wavelengths at Holes 1080A and 1080B. A nine- and five-point smoothing procedure was applied to the data sets for Holes 1080A and 1080B, respectively.