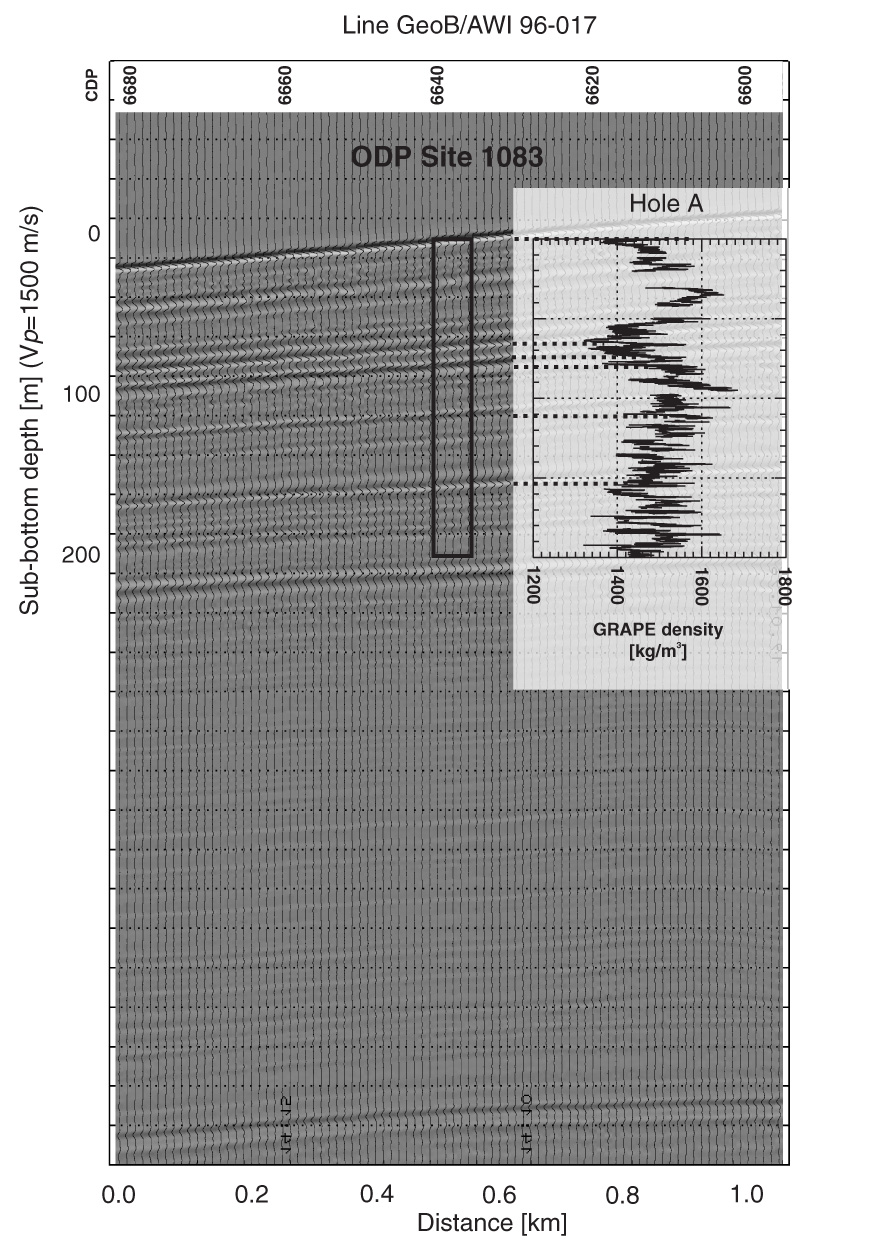
Figure 12. Close-up of Line GeoB/AWI 96-017 near Site 1083. Amplitudes are grayscaled. For comparison, GRAPE density data from MST measurements are shown, and main reflectors are correlated with local extremes in the density log (thick dashed lines). For depth determination, a sound velocity Vp of 1500 m/s was used.