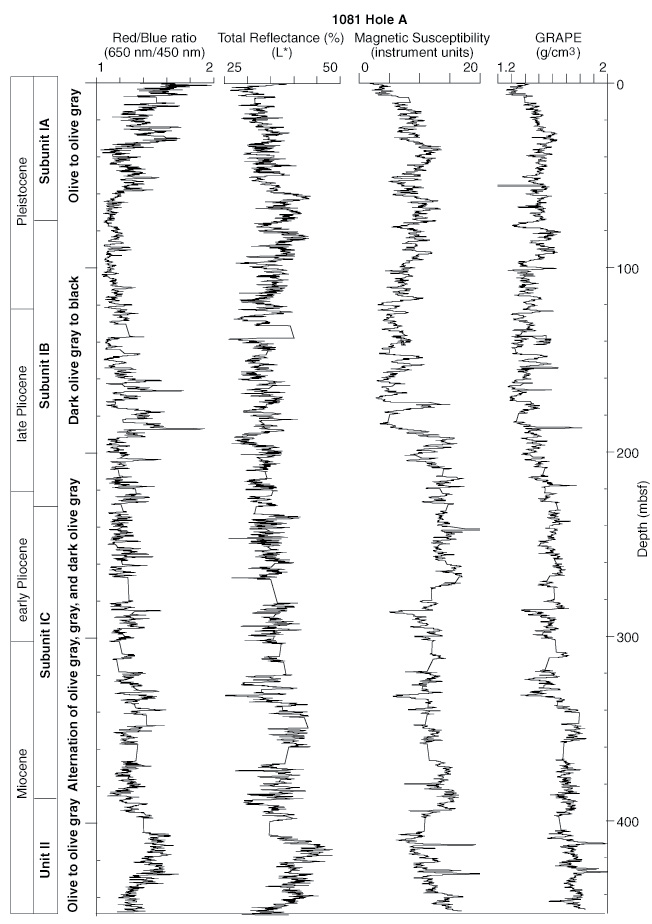
Figure 18. Stratigraphic variation in the red/blue ratio (650 nm/450 nm), total reflectance, magnetic susceptibility, and GRAPE density at Hole 1081A. Ages (see
"Biostratigraphy and Sedimentation Rates" section, this chapter), lithostratigraphic subunits, and the main color changes based on the Munsell Color Chart are indicated.


![]()