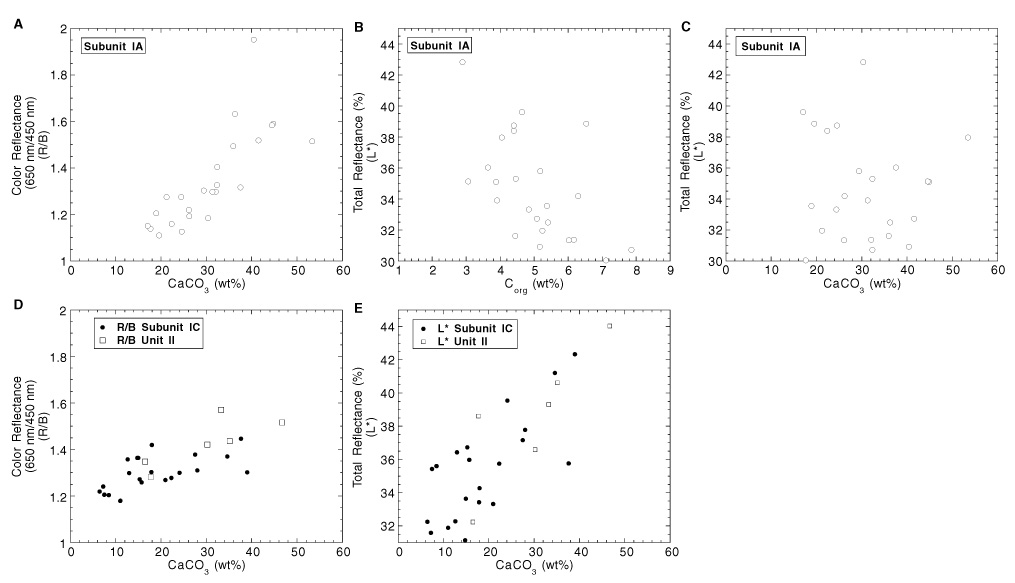
Figure 19. Comparison between calcium carbonate and organic carbon contents (in weight percent) with the red/blue wavelength spectral ratio and total reflectance for lithostratigraphic units at Hole 1081A. A–C. Subunit IA. D–E. Subunit IC and Unit II.