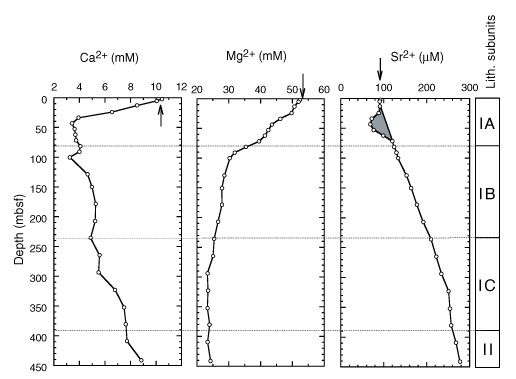
Figure 31. Downcore profiles of Ca2+, Mg2+, and Sr2+ at Site 1081. Litho-stratigraphic subunits shown on right-hand bar. Arrows = mean ocean-bottom-water values taken from Millero and Sohn (1992). Shaded region = position of local Sr2+ sink, superimposed over the general increase recording dissolution of biogenic calcite.


![]()