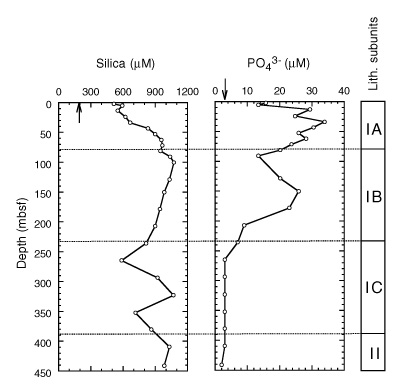
Figure 32.
Downcore profiles of dissolved silica and phosphate at Site 1081. Lithostratigraphic subunits shown on right-hand bar. Arrows = mean ocean-bottom-water values taken from Millero and Sohn (1992).