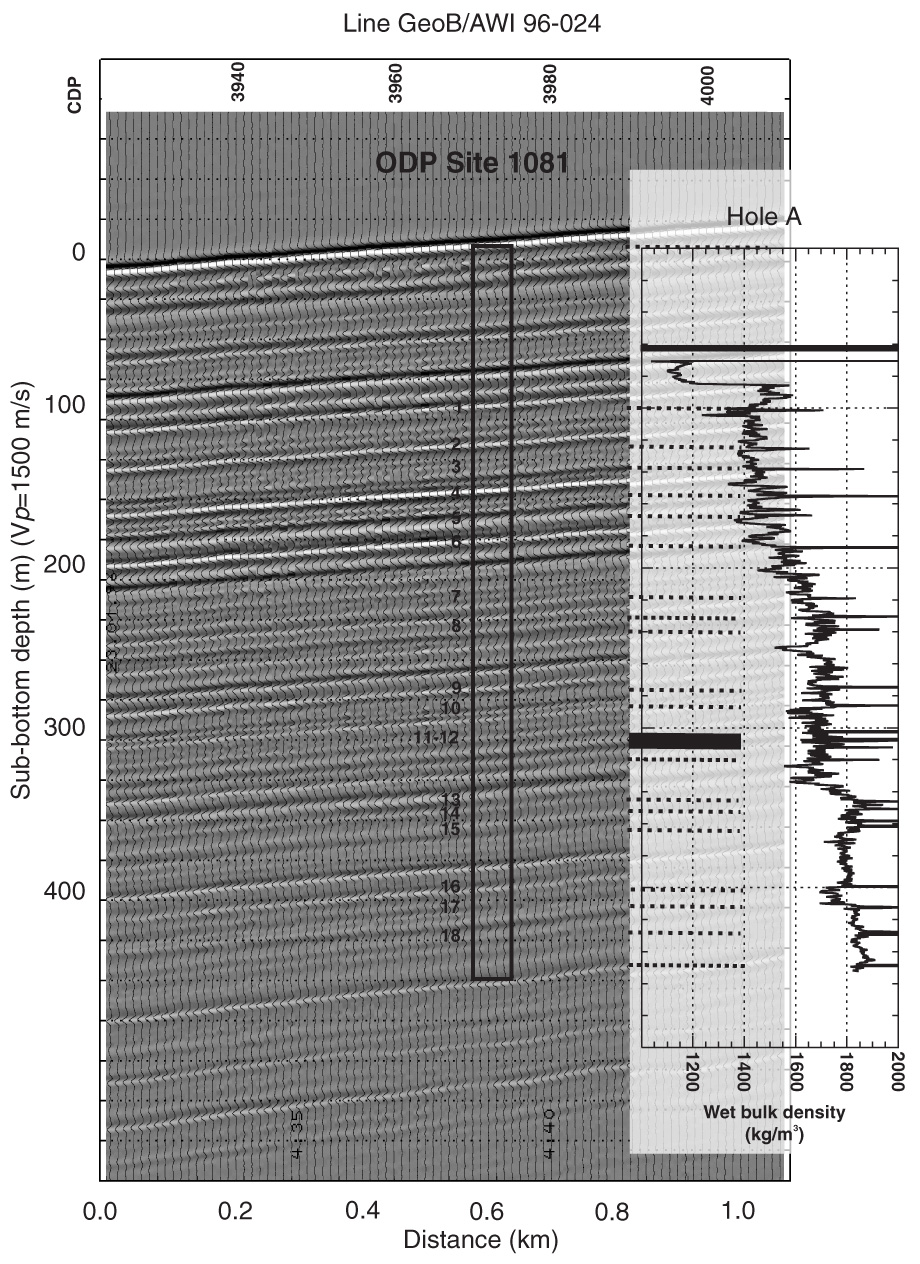
Figure 8. Close-up of Line GeoB/AWI 96-024 near Site 1081. Amplitudes are grayscaled. For comparison, density data from downhole logging are shown. Consecutive numbers indicate occurrences of lithified intervals, dolomitic clays, or extreme GRAPE density values, all corresponding to peaks in density on the downhole log. Many peaks are associated with seismic reflectors (thick dashed lines). For depth determination, a sound velocity (Vp) of 1500 m/s was used.