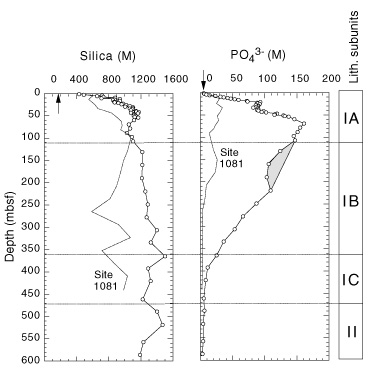
Figure 19. Downcore profiles of dissolved silica and phosphate at Site 1082 (solid lines with open circles). Profile measured at Site 1081 (dotted lines) is shown for comparison. Lithostratigraphic subunits shown on right-hand bar. Shaded region = depth zone of increased dissolved phosphate removal. Arrows = mean ocean-bottom-water values taken from Millero and Sohn (1992).