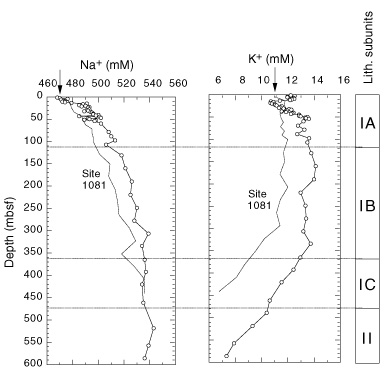
Figure 20. Downcore profiles of dissolved Na+ and K+ at Site 1082 (solid lines with open circles). Profile measured at Site 1081 (dotted lines) is shown for comparison. Lithostratigraphic subunits shown on right-hand bar. Arrows = mean ocean-bottom-water values taken from Millero and Sohn (1992).