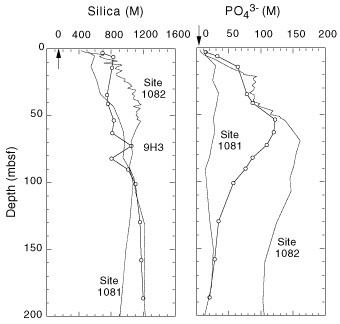
Figure 13. Downcore profiles of dissolved silica and phosphate at Site 1083 (solid lines with open circles). Profiles for Sites 1081 and 1082 (dotted lines) are shown for comparison. Position of Section 175-1083A-9H-3 indicated (see text). Arrows = mean ocean-bottom-water values taken from Millero and Sohn (1992).