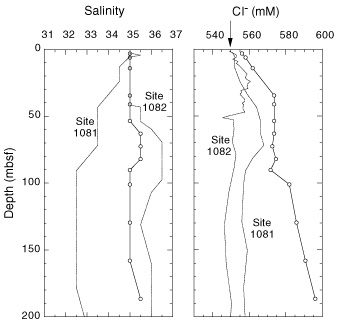
Figure 15. Downcore profiles of salinity and dissolved Cl– at Site 1083 (solid lines with open circles). Profiles for Sites 1081 and 1082 (dotted lines) are shown for comparison. Arrow = mean ocean-bottom-water value taken from Millero and Sohn (1992).