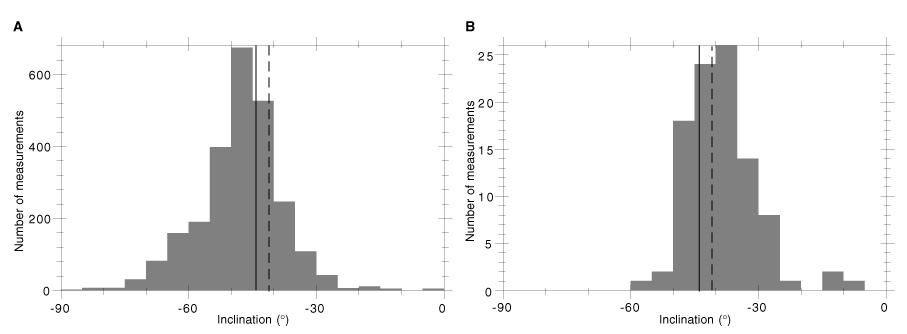
Figure 16. Distribution of inclination during the Brunhes Chron from Cores 175-1084A-1H through 16H. A. Half-core measurements. B. Discrete samples. Solid line = the inclination expected from the geocentric axial dipole model at this site; dashed line = the inclination expected after correcting for the anomaly caused by nondipole components (+3° Merrill and McElhinny, 1983).