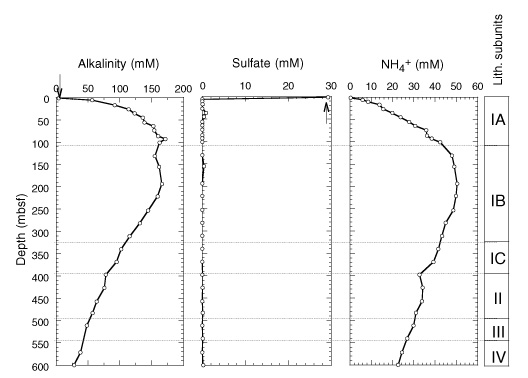
Figure 20. Downcore profiles of dissolved alkalinity, sulfate, and ammonium at Site 1084. Lithostratigraphic subunits shown on right-hand bar. Arrows = mean ocean-bottom-water values taken from Millero and Sohn (1992). Notice change in scale of ammonium axis (in mM) compared with previous Leg 175 sites (in �M).