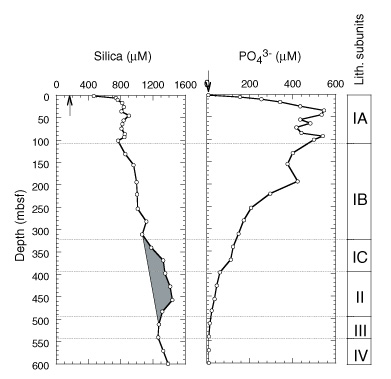
Figure 22. Downcore profiles of dissolved silica and phosphate at Site 1084. Lithostratigraphic subunits shown on right-hand bar. Shaded region = zone of increased dissolved silica caused by the greater abundance of diatoms through the interval. Arrows = mean ocean-bottom-water values taken from Millero and Sohn (1992).