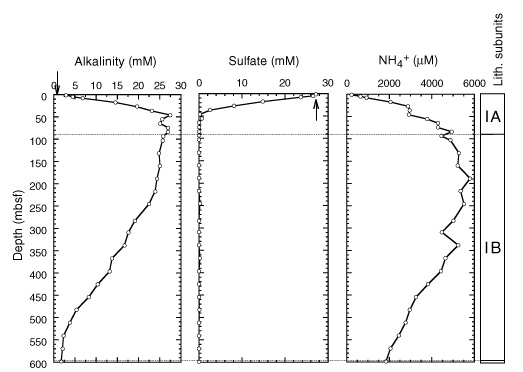
Figure 19. Downcore profiles of dissolved alkalinity, sulfate, and ammonium at Site 1085. Lithostratigraphic subunits shown on right-hand bar, with Unit II too small to indicate. Arrows = mean ocean-bottom-water values taken from Millero and Sohn (1992).