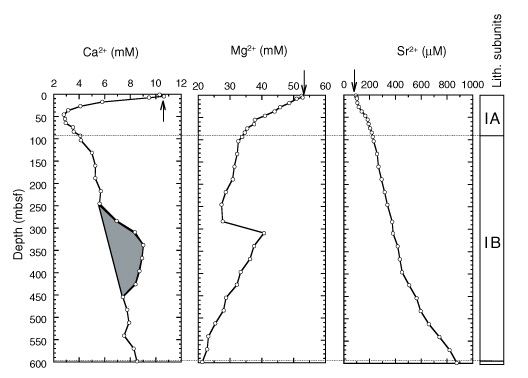
Figure 20. Downcore profiles of Ca2+, Mg2+, and Sr2+ at Site 1085. Litho-stratigraphic subunits shown on right-hand bar, with Unit II too small to indicate. Shaded region = depth interval of elevated dissolved Ca2+ concentrations. Arrows = mean ocean-bottom-water values taken from Millero and Sohn (1992).