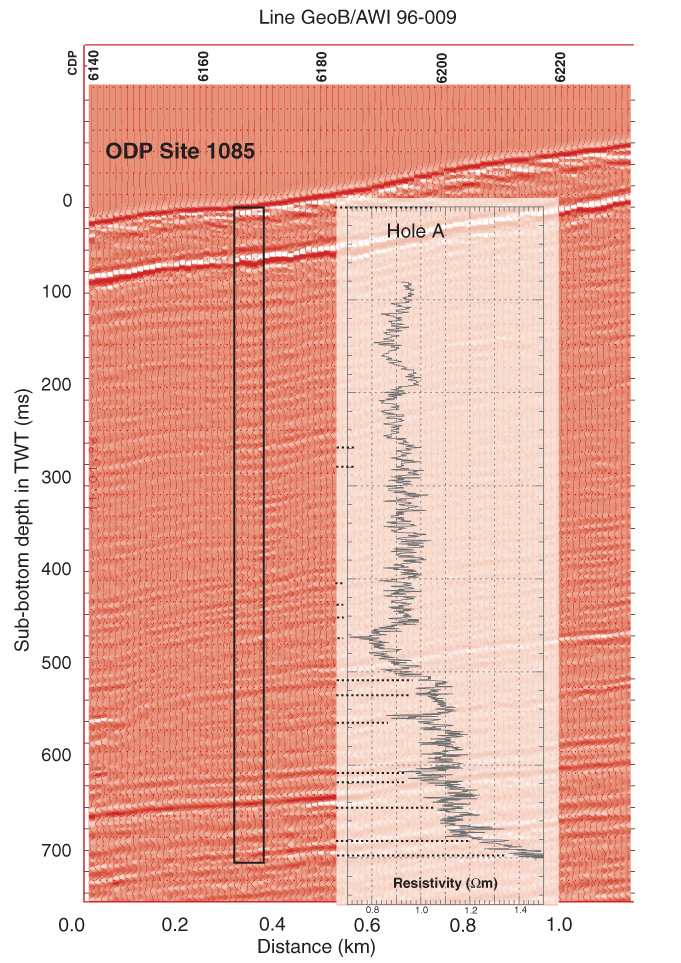
Figure 4. Close-up of Line GeoB/AWI 96-009 near Site 1085. Vertical axis is given in TWT. Amplitudes are grayscaled. For comparison, the resistivity log from downhole logging is shown. Logging depth is transferred to TWT using the logging results. Selected reflectors can be correlated with local extremes in the resistivity log (straight thick dashed lines).