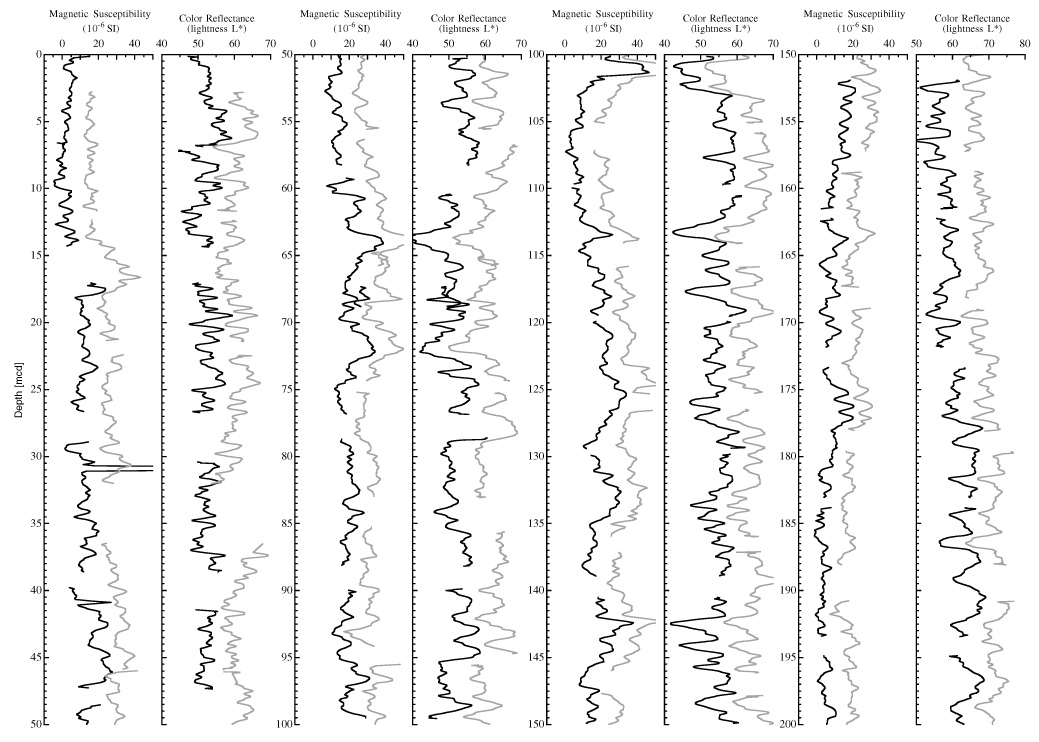
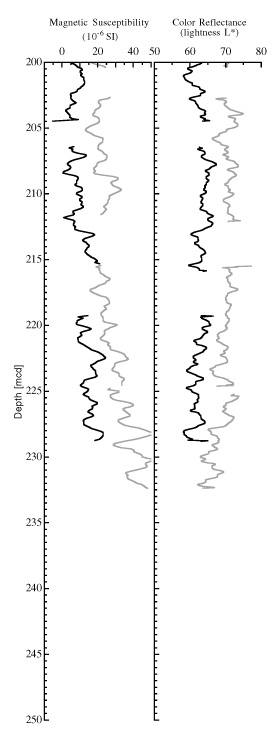
Figure 13. Composite section for Site 1086. Magnetic susceptibility and color reflectance (lightness L*) data are plotted for Holes 1086 A (black line) and 1086B (gray line). Note the scale shift for the rightmost plot of lightness (L*). The downhole logs are shown in meters composite depth (mcd). An offset of 1.5 times the standard deviation of Hole 1086A data have been added to Hole 1086B for clarity in viewing the composite section.