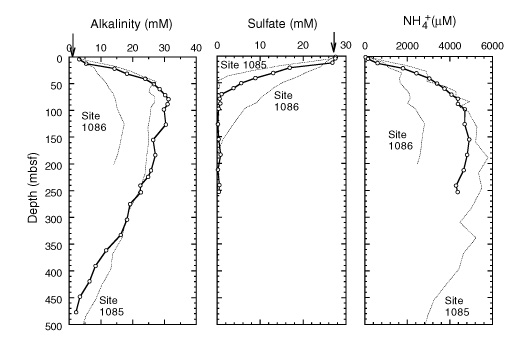
Figure 12. Downcore profiles of dissolved alkalinity, sulfate, and ammonium at Site 1087 (solid lines with open circles). Profiles from Sites 1085 and 1086 (dotted lines) are shown for comparison. Arrows = mean ocean-bottom-water values taken from Millero and Sohn (1992). Note the extended depth scale compared with those in
Figures 13,
14, and
15.