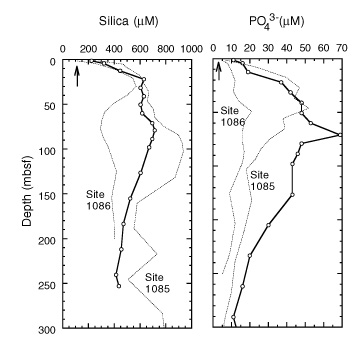
Figure 14. Downcore profiles of dissolved silica and phosphate at Site 1087 (solid lines with open circles). Profiles from Sites 1085 and 1086 (dotted lines) are shown for comparison. Arrows = mean ocean-bottom-water values taken from Millero and Sohn (1992).