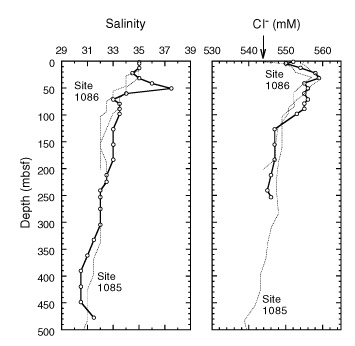
Figure 16. Downcore profiles of salinity and dissolved Cl– at Site 1087 (solid lines with open circles). Profiles from Sites 1085 and 1086 (dotted lines) are shown for comparison. Arrow = mean ocean-bottom-water value taken from Millero and Sohn (1992). Note extended depth scale compared with those in Figures 13, 14, and 15.
![]()